Continuous Improvement
How to Calculate Manufacturing Efficiency in Excel
A simple efficiency calculation can help identify jobs that need process review.
Basic formula
Efficiency % = Planned Hours ÷ Actual Hours × 100
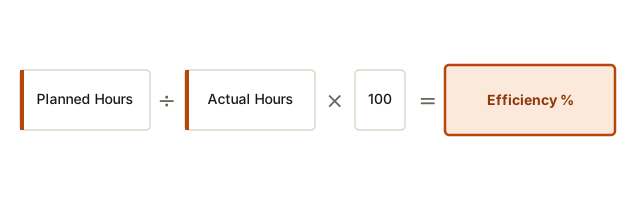
This is a labor or performance efficiency metric — it compares how long a job was estimated to take against how long it actually took. That's a different measurement than utilization or OEE, which look at how much of the available time was spent producing at all, rather than how a specific job compared to its own estimate.
Excel formula
If planned hours are in cell B2 and actual hours are in C2:
=IFERROR(B2/C2,0)
Format the result as a percentage.
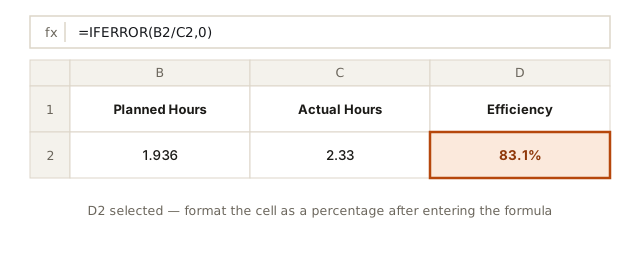
IFERROR exists for data hygiene, not business logic: a job with zero actual hours logged, whether from a data-entry gap or a job that hasn't started yet, would otherwise throw #DIV/0! and break any report or chart built downstream of the cell.
Example
Planned time: 1.936 hours. Actual time: 2.33 hours.
Efficiency = 1.936 ÷ 2.33 × 100 = approximately 83.1%.
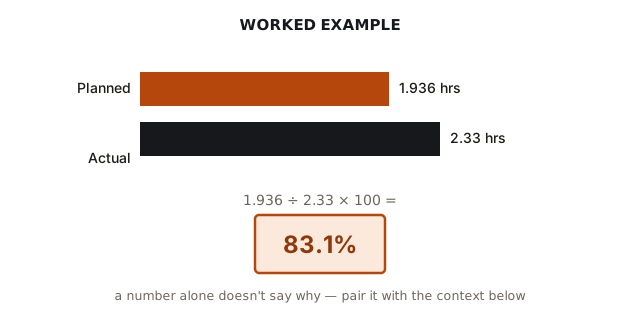
2.33 actual hours against 1.936 planned hours means the job took about 20% longer than estimated (2.33 ÷ 1.936 ≈ 1.203), which is where the 83.1% comes from — the formula is just the inverse of that ratio, scaled to a percentage.
Use the result carefully
Efficiency should be reviewed together with quality, downtime, rework, material shortages, and job complexity.
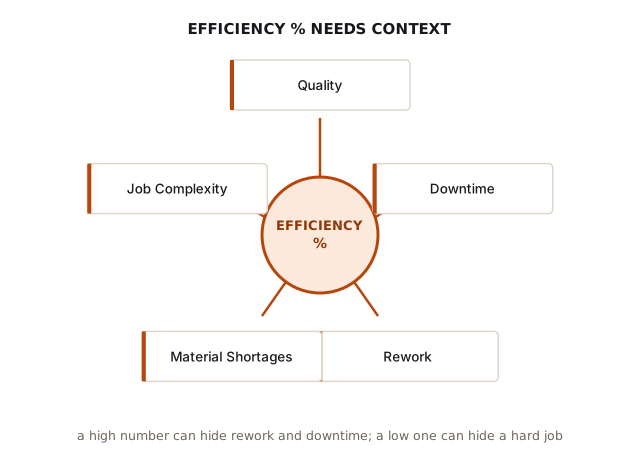
A single efficiency number can't distinguish between an operator working slowly and a job that had a material shortage, unplanned downtime, or necessary rework baked into the actual hours — none of which reflect on the person doing the work, and all of which drag the percentage down. It cuts the other way too: a standard time that's set too generously makes every job look artificially efficient. And if this number gets used to evaluate people rather than to flag jobs worth investigating, it stops being reliable — people learn to pad actual-hours reporting or push for looser planned times, and the metric ends up measuring the gaming rather than the work.